Topic Menu
- Home
- News, research & events
- Current Projects
- Safer Roads
- Report a hazard
- Safer People
- Safer Equipment
- Safety Co-ordination
- References
- Sitemap

Motorcycle Crash Data 2006-2010
Approximately two and half thousand motorcycle crashes are reported each year in NSW. They represent 6% of all road crashes, but account for 15% of all deaths and 10% of all injuries on NSW roads. The following information covers all serious motorcycle road crashes reported to police for the period 2006-2010 (RTA, 2010). Download full report MCC crash facts 2010
Over the last five years in NSW, road crashes in general have decreased by 7%, whereas motorcycle crashes have risen by 7%. Over the same period, the number of registered motorcycles has increased by 38%, compared to only 3% for all passenger vehicles. Riding is not becoming more dangerous, there are just a lot more of us on the road.
This does mean that more needs to be done to make motorcycling safer. Riders can best protect themselves if they understand and manage their risks.
Some facts about motorcycle crashes in NSW, 2006-2010
| Year | 2006 | 2007 | 2008 | 2009 | 2010 | Total |
| Severity of accidents | ||||||
| Fatal | 66 | 62 | 54 | 68 | 59 | 309 |
| Injury | 2,260 | 2,199 | 2,374 | 2,556 | 2,413 | 11,802 |
| Non-casualty(tow-away) | 229 | 259 | 254 | 279 | 254 | 1,275 |
| Total crashes | 2,555 | 2,520 | 2,682 | 2,903 | 2,726 | 13,386 |
| Number of casualties | ||||||
| Killed | 66 | 64 | 55 | 70 | 61 | 316 |
| Injured | 2,450 | 2,388 | 2,576 | 2,738 | 2,590 | 12,742 |
| Total casualties | 2,516 | 2,452 | 2,631 | 2,808 | 2,651 | 13,058 |
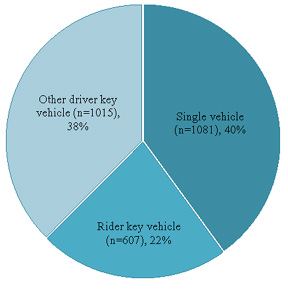
It is useful to distinguish between the three main categories of motorcycle crash in order to understand what went wrong. These are:
- Single vehicle crashes (40%)
- Collisions with other vehicles due to the rider's action (22%), and
- Collisions due to the other driver(38%).
Although it is difficult to determine fault from crash data, it is possible to identify the key vehicle whose movement was primarily the cause of the first impact. The pie chart below illustrates the proportions of crashes in each of these three categories.
Single vehicle crashes (40%)
Four out of ten reported motorcycle crashes are single vehicle crashes. Each year in NSW, over 1,000 riders are involved in serious single vehicle crashes, including a high proportion (44%) of all motorcycle fatalities.
Why do they crash?
Almost half (48%) involved excessive speed for the conditions. This does not necessarily mean exceeding the speed limit, but they were going too fast to save themselves when things went wrong.
Perhaps surprisingly, single vehicle crashes are almost equally likely to happen on straight (48%) sections of road as on curves (52%).
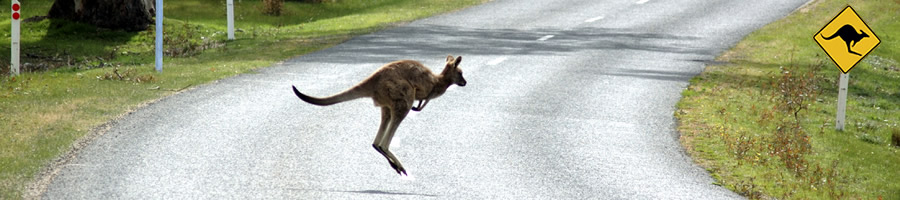
Most single vehicle crashes are due to rider error, but about one in five involved loose gravel, pot holes, oil or other road surface hazards. Over the past five years (2006-2010) there were 9 fatal and 911 injury crashes associated with such hazards. Animals on the road are a contributing factor in 6% of crashes.
Crashes on curves are more likely than those on the straight (23% vs 13%), to involve some sort of road surface hazard, such as loose gravel, pot holes or diesel.
DON'T RIDE FASTER THAN YOU CAN SEE
Collisions with other vehicles - other driver at fault
The other vehicle in a multi-vehicle motorcycle crash was most likely to be a private car (81%) or light truck (9%).
Collisions with light trucks are more likely to result in severe injuries and include 19% of all fatal multi-vehicle motorcycle crashes.
The majority (61%) of multi-vehicle crashes are due to the action of the other driver, usually failing to see or give way to the rider.
Over half (57%) of all multi-vehicle collisions are at intersections and 71% of intersection crashes are due to the actions of the other driver.
T-junctions are the most dangerous type of intersection for riders, they account for almost a third (30%) of all collisions and 20% of all fatal collisions. Collisions at cross roads are less common (18%) but include 13% of fatal collisions.
A high proportion of collisions at roundabouts (73%), t-junctions (70%) and cross roads (72%) were due to the actions of the other driver.
Apart from intersection crashes, the most common multi-vehicle crashes due to other drivers are changing lanes (21%), emerging from a driveway (9%) and making a U-turn (8%).
DON'T ASSUME THEY HAVE SEEN YOU
Collisions with other vehicles – rider at fault
Rear end collisions make up 19% of crashes and more often than not it is rider into other vehicle (61%).
ALWAYS LEAVE A 3 SECOND GAP IN FRONT OF YOU. 4 TYRES CAN STOP QUICKER THAN 2
Head-on collisions make up 6% of crashes and are also more likely to be due to the rider (76%). These are not overtaking crashes, but due to the rider being on the wrong side of the road, often on a corner
ON CORNERS, GO IN SLOW AND WIDE, GET OUT FAST AND NARROW
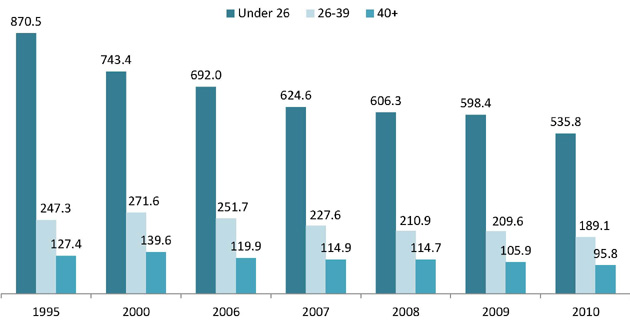
Riders involved in crashes
Young riders are involved in a high proportion of crashes relative to their involvment in motorcycling. Averaged over the past five years, riders under the age of 26 were involved in approximately 28% of all crashes but were the registered owners of only 9% of motorcycles in NSW. Riders aged over 40 were involved in 32% of crashes but owned some 57% of all motorcycles.